East Greenwich, Rhode Island, celebrated for its historic Main Street, vibrant dining scene, and high-performing schools, has stood out as one of the Ocean State’s most desirable addresses. Over the past five years, this lush green suburb has witnessed a dynamic transformation in its real estate market—driven by shifting economic factors, urban migration, and the aftermath of the pandemic. This comprehensive analysis explores East Greenwich’s housing market from 2020 to 2025, focusing on home price trends, transaction costs, days on market, and annual sales volume.
Overview of East Greenwich’s Real Estate Market
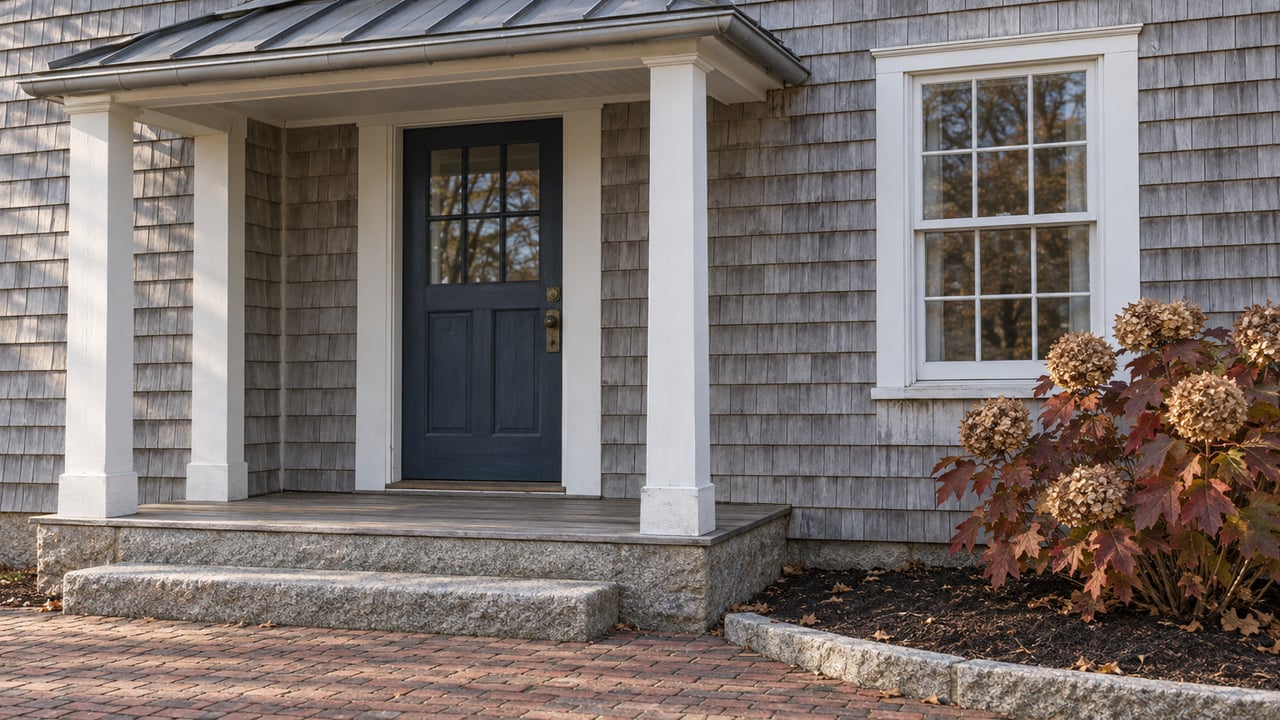
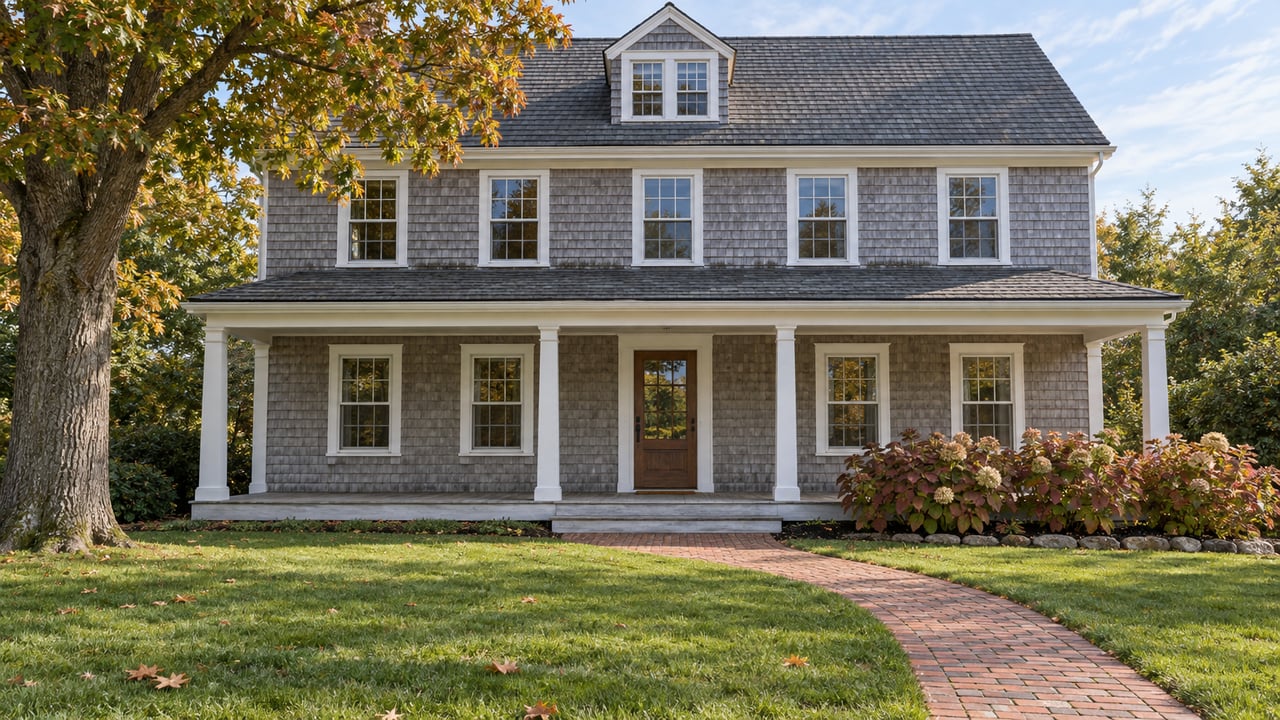
East Greenwich's real estate market is defined by a diverse mix of stately Colonials, elegant Capes, and modern new construction, set along tree-lined streets, waterfront neighborhoods, and rolling countryside. The town attracts a blend of families seeking top-tier schools, professionals commuting to Providence or Boston, retirees downsizing from larger homes, and investors looking for stable returns. Over the last five years, demand has surged, especially among buyers relocating from urban areas and out-of-state, drawn by East Greenwich’s quality of life, strong community, and proximity to Narragansett Bay.
Home Price Trends: 2020–2025
Steady Appreciation in a Competitive Market
From 2020 through 2025, East Greenwich has seen robust growth in home prices, echoing trends across southern New England’s most coveted suburbs. The initial uncertainty in early 2020 soon gave way to intense competition, as buyers sought more space and stability amid a surge in remote work and lifestyle reevaluation.
· In 2020, the median sale price for a single-family home in East Greenwich was approximately $495,000.
· By 2021, the median price climbed by nearly 13% to $560,000, fueled by low mortgage rates and limited housing supply.
· 2022 continued the upward trend, with median prices reaching $610,000 as competition for turnkey homes intensified.
· In 2023, the town’s reputation, high-performing schools, and tight inventory pushed the median price to $650,000.
· By summer 2025, East Greenwich’s median sale price approached $700,000—an overall increase of more than 40% over five years.
Drivers of Price Growth
· Remote work flexibility, allowing buyers to shift from cities to suburbs
· Highly ranked schools and community amenities
· Limited new construction and strict zoning
· Low inventory, especially in established neighborhoods and waterfront areas
Change in Costs: Mortgage Rates, Taxes, and Maintenance
Mortgage Rates
Borrowing costs fluctuated significantly during this period. Record-low mortgage rates, which dipped below 3% in 2020 and 2021, ignited a buying frenzy and contributed to fast price gains. By late 2022 and throughout 2023, rates rose above 6% as inflationary pressures increased, tempering price acceleration but not dampening demand. In 2024 and 2025, higher interest rates made some buyers more cautious, yet the desirability of East Greenwich helped sustain home values.
Property Taxes and Insurance
Property taxes have risen moderately, paralleling the appreciation in home values, but remain competitive compared to other high-performing New England suburbs. Homeowners on the water or in flood zones have seen insurance premiums climb—some by as much as 20% over five years—reflecting increased rebuilding costs and tighter underwriting.
Maintenance and Renovation
Home upkeep and renovation costs escalated, fueled by inflation and ongoing supply chain disruptions. Owners report annual maintenance expenses rising 10–15% since 2020, particularly for historic homes and properties requiring modern upgrades or energy efficiency improvements.
Days on Market: Homes Move Quickly
Accelerated Market Velocity
The average days on market (DOM) for East Greenwich homes dropped sharply in the early 2020s, illustrating surging demand and a shortage of available listings.
· In 2020, homes typically spent about 42 days on the market.
· By 2021, DOM fell to just 21–25 days, with multiple-offer situations common for updated homes.
· 2022 and 2023 saw average DOM decline further, with most homes selling within 15–20 days—some going under contract in less than a week.
· With mortgage rates rising in 2024–2025, market times moderated to 25–30 days, still well below pre-pandemic levels.
Multiple Offers and Buyer Strategies
· All-cash offers and waived contingencies became more typical, especially for homes in premier neighborhoods such as High Hawk or the Hill & Harbour District.
· Open houses were often packed, and sellers enjoyed increased negotiating power.
Number of Homes Sold: Inventory Sets the Pace
Sales Volume Trends
Annual transaction volume in East Greenwich reflected both sustained demand and persistent inventory constraints:
· In 2020, around 240 single-family homes were sold.
· 2021 saw a spike to approximately 270 sales as new buyers entered the market.
· 2022 recorded strong activity with about 260 homes sold.
· 2023 saw sales dip slightly to 235, as available listings tightened further.
· By mid-2025, annual sales stabilized near 240 homes, demonstrating consistent demand despite higher prices and borrowing costs.
Inventory Constraints
· Strict zoning and preservation of historic districts limited new construction.
· Long-term ownership patterns and few new developments kept listing volume low, intensifying competition for available homes.
Market Drivers and Demographic Shifts
· Out-of-State Buyers: Many new residents hailed from New York, Massachusetts, and Connecticut, seeking suburban lifestyle upgrades, remote work flexibility, or long-term investments.
· Families and Professionals: The town’s top-ranking schools and safe neighborhoods attracted families and relocated professionals, further fueling demand for move-in-ready homes.
· Retirees: The walkable downtown and strong healthcare access continued to draw retirees downsizing from larger homes in the region.
· Investors: Strong rental demand and long-term appreciation potential made East Greenwich popular with small-scale investors.
Challenges Facing East Greenwich’s Market
Affordability Pressures
Rapid home price appreciation has placed single-family home ownership beyond the reach of many local families and first-time buyers, increasing demand for apartments, condos, and rental homes.
Preservation vs. Growth
Efforts to maintain East Greenwich’s historic charm and green space have restricted new development, further tightening supply and underpinning high prices.
Insurance and Climate Risks
As in other coastal communities, rising insurance costs and heightened awareness of climate risks—especially flooding—have become more significant factors in buyer decision-making and affordability.
Looking Forward: The Next Five Years
While higher mortgage rates and economic uncertainty may temper future growth, East Greenwich’s enduring appeal—its historic Main Street, strong schools, and scenic neighborhoods—suggests continued market strength. Balancing preservation, development, and affordability will be essential to supporting a sustainable and vibrant housing market.
Conclusion
Between 2020 and 2025, East Greenwich, RI, has undergone significant real estate appreciation, with median home prices rising over 40%, days on market falling to record lows, and sales volumes remaining robust amid tight inventory. The community’s blend of history, amenities, and accessibility continues to attract buyers from across the region, securing East Greenwich’s status as one of Rhode Island’s most sought-after and competitive housing markets.