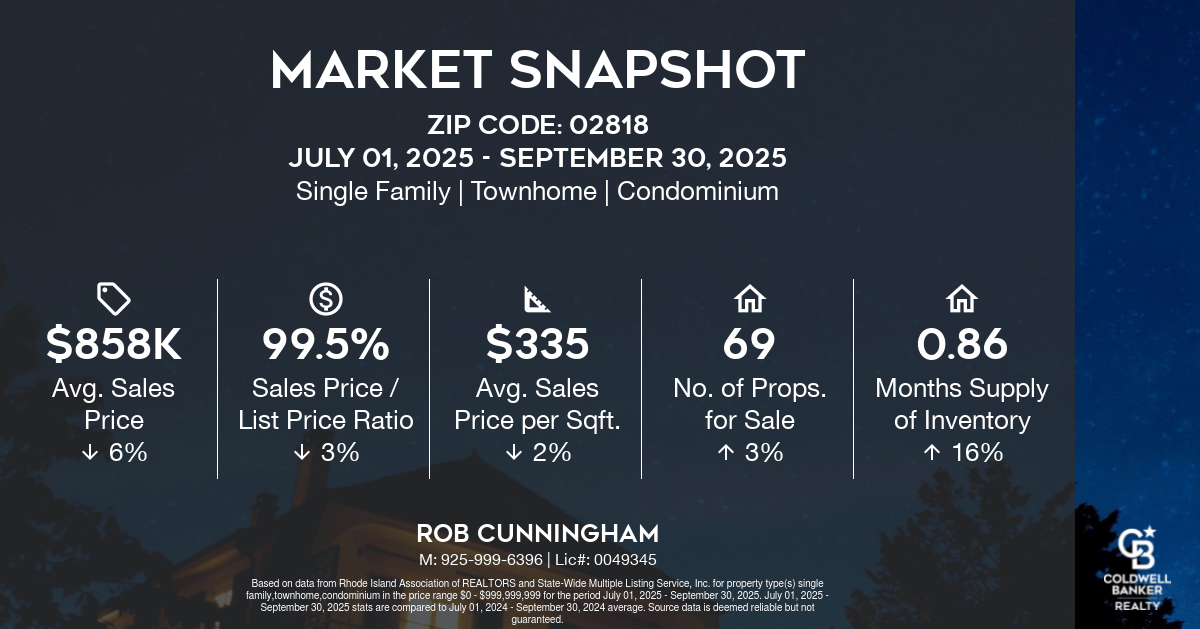
The Q3 2025 market snapshot for East Greenwich (ZIP code 02818) reflects a market in transition, with modest pricing adjustments and a slight increase in inventory. Covering the period from July 1 to September 30, 2025, this data includes single-family homes, townhomes, and condominiums.
Key Metrics:
- Average Sales Price: $858K — down 6%
- Sales Price/List Price Ratio: 99.5% — down 3%
- Average Sales Price per Sqft: $335 — up 2%
- Number of Properties for Sale: 69 — up 3%
- Months Supply of Inventory: 0.86 months — up 16%
Trends & Implications:
1. Slight Market Correction
East Greenwich experienced a 6% dip in average sales price, suggesting a mild market correction. However, the 2% increase in price per square foot indicates that well-located or updated homes are still commanding strong value.
2. Reduced Seller Leverage
The sales-to-list price ratio declined to 99.5%, showing that buyers are negotiating slightly more than in previous quarters, though sellers still retain favorable positioning.
3. Inventory Holding Steady
With a modest 3% increase in listings and a 16% rise in months of inventory, the market is gradually offering more options to buyers while remaining competitive.
Market Effects:
- Buyers: May find slightly more flexibility in pricing and a growing selection of homes.
- Sellers: Should price strategically to remain competitive in a market adjusting to buyer expectations.
- Investors: East Greenwich remains a stable, long-term investment market with consistent demand and modest price fluctuations.
Rob Cunningham
📞 Mobile: 925-999-6396
📧 Email: [email protected]
Let’s talk about how you can make the most of East Greenwich’s evolving real estate landscape.